Contents
- What the Cooper test is
- How to use the calculator
- Your result in one table
- Where the test came from
- How to do the test
- How to measure the distance
- Lap splits: how not to ruin the test with pacing
- Results table by age and sex
- VO2max from the formula
- The limits of the formula
- From the result to training pace
- The most common mistakes in the test
- When to test during the year, and how often
- Cooper test or a 5K test
- What to do with the result
- Frequently asked questions
Cooper test calculator
Enter your 12-minute distance and we will show estimated pace ranges.
This is an estimate. Your coach sets the exact ranges after a test in the app.
What the Cooper test is
The Cooper test is 12 minutes of running in which you cover as much distance as you can. The result is a number of meters, not a time. There is no finish line: after 12 minutes the stopwatch stops and you check how far you got.
The whole test fits into five steps:
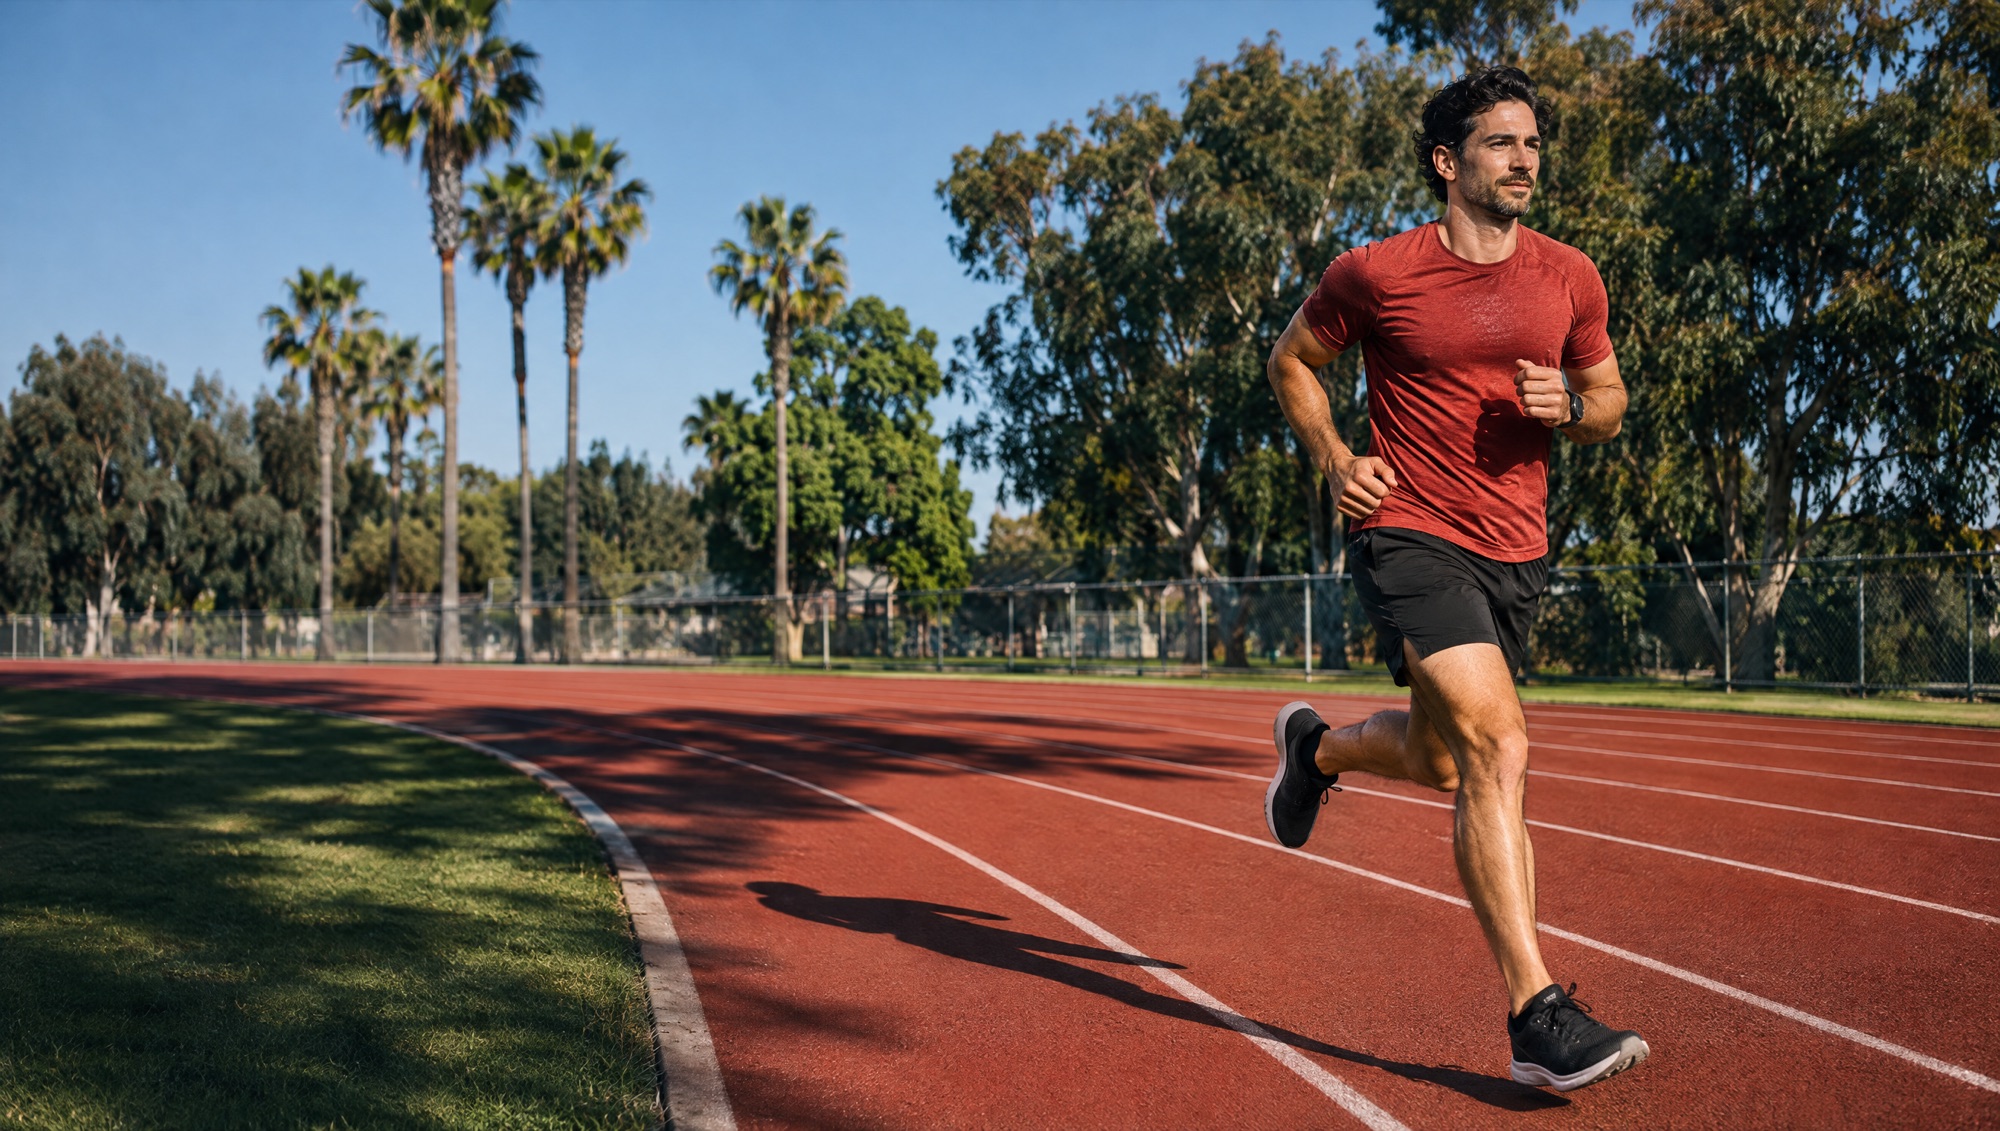
- A route and a stopwatch. You need a route where the distance can be counted, ideally a 400 m athletics track, and a stopwatch or a watch with a countdown.
- Warm-up. 15–20 minutes of jogging and a few short strides.
- 12 minutes of running. Run evenly and hard enough that little is left at the end. Walking is allowed, but it lowers the result.
- Stop and measure. Stop where the 12 minutes run out and count the distance: full laps plus the remainder.
- Read the result. Enter the meters in the calculator to get your pace zones. The tables below give an estimated aerobic capacity and a rating for your age.
An example: six laps of the track are 2,400 m (1.49 miles), an average pace of 5:00/km (8:03/mile). Six laps and another 250 m are 2,650 m and a pace of 4:32/km (7:17/mile).
Why is 12 minutes enough? In an effort that long, the result depends mainly on aerobic fitness, not on sprinting. That is why one number lets you estimate maximal oxygen uptake (VO2max) and set training paces. The test was developed in the 1960s by the physician Kenneth Cooper, as described in the section on the history of the test.
Two things decide whether the result is worth anything: repeatable conditions and an accurate distance. Both are described step by step below.
How to use the calculator
The calculator above the text converts a test result into training zones. Enter a distance from 1,000 to 4,500 m, or set it with the slider, and you will see paces for five zones: Easy, Aerobic, Tempo, Threshold and VO2max. A switch changes the unit from kilometers to miles. The result itself is always entered in meters; if you think in miles, one mile is 1,609 m and four laps of a 400 m track are 0.994 miles.
An example: 2,650 m is an average of 4:32/km (7:17/mile). The Easy zone comes out at 6:17–7:18/km (10:07–11:45/mile) and Threshold at 4:49–5:09/km (7:45–8:17/mile). The rest follows from the formulas described below: the Cooper formula gives about 48 ml/kg/min, and the Riegel formula about 23:31 for 5K, 49:02 for 10K and 1:48:12 for the half marathon. Two practical conclusions follow from these numbers: easy runs faster than 6:17/km (10:07/mile) are already outside the Easy zone, and a 10K in 50:00 is within reach of your current fitness.
Your result in one table
Find the distance closest to yours in the first column. VO2max, your maximal oxygen uptake, is calculated with the formula from Cooper's paper, and the race times with the Riegel formula and an exponent of 1.06. Both are estimates. For most recreational runners the marathon prediction will be too optimistic, as explained further down.
| Distance in 12 min | Pace per km | Pace per mile | VO2max (ml/kg/min) | 5K | 10K | Half marathon | Marathon |
|---|---|---|---|---|---|---|---|
| 1,800 m | 6:40 | 10:44 | 29 | 35:26 | 1:13:53 | 2:43:02 | 5:39:55 |
| 2,000 m | 6:00 | 9:39 | 33 | 31:42 | 1:06:05 | 2:25:48 | 5:04:00 |
| 2,200 m | 5:27 | 8:47 | 38 | 28:39 | 59:44 | 2:11:48 | 4:34:47 |
| 2,400 m | 5:00 | 8:03 | 42 | 26:08 | 54:28 | 2:00:11 | 4:10:34 |
| 2,600 m | 4:37 | 7:26 | 47 | 24:00 | 50:02 | 1:50:24 | 3:50:11 |
| 2,800 m | 4:17 | 6:54 | 51 | 22:11 | 46:16 | 1:42:04 | 3:32:48 |
| 3,000 m | 4:00 | 6:26 | 56 | 20:37 | 43:00 | 1:34:52 | 3:17:48 |
| 3,200 m | 3:45 | 6:02 | 60 | 19:16 | 40:09 | 1:28:36 | 3:04:43 |
| 3,400 m | 3:32 | 5:41 | 65 | 18:04 | 37:39 | 1:23:05 | 2:53:13 |
A handy reference point: six laps of a 400 m track are 2,400 m, an even 5:00/km (8:03/mile) for 12 minutes. That is 14 m short of a mile and a half.
Where the test came from
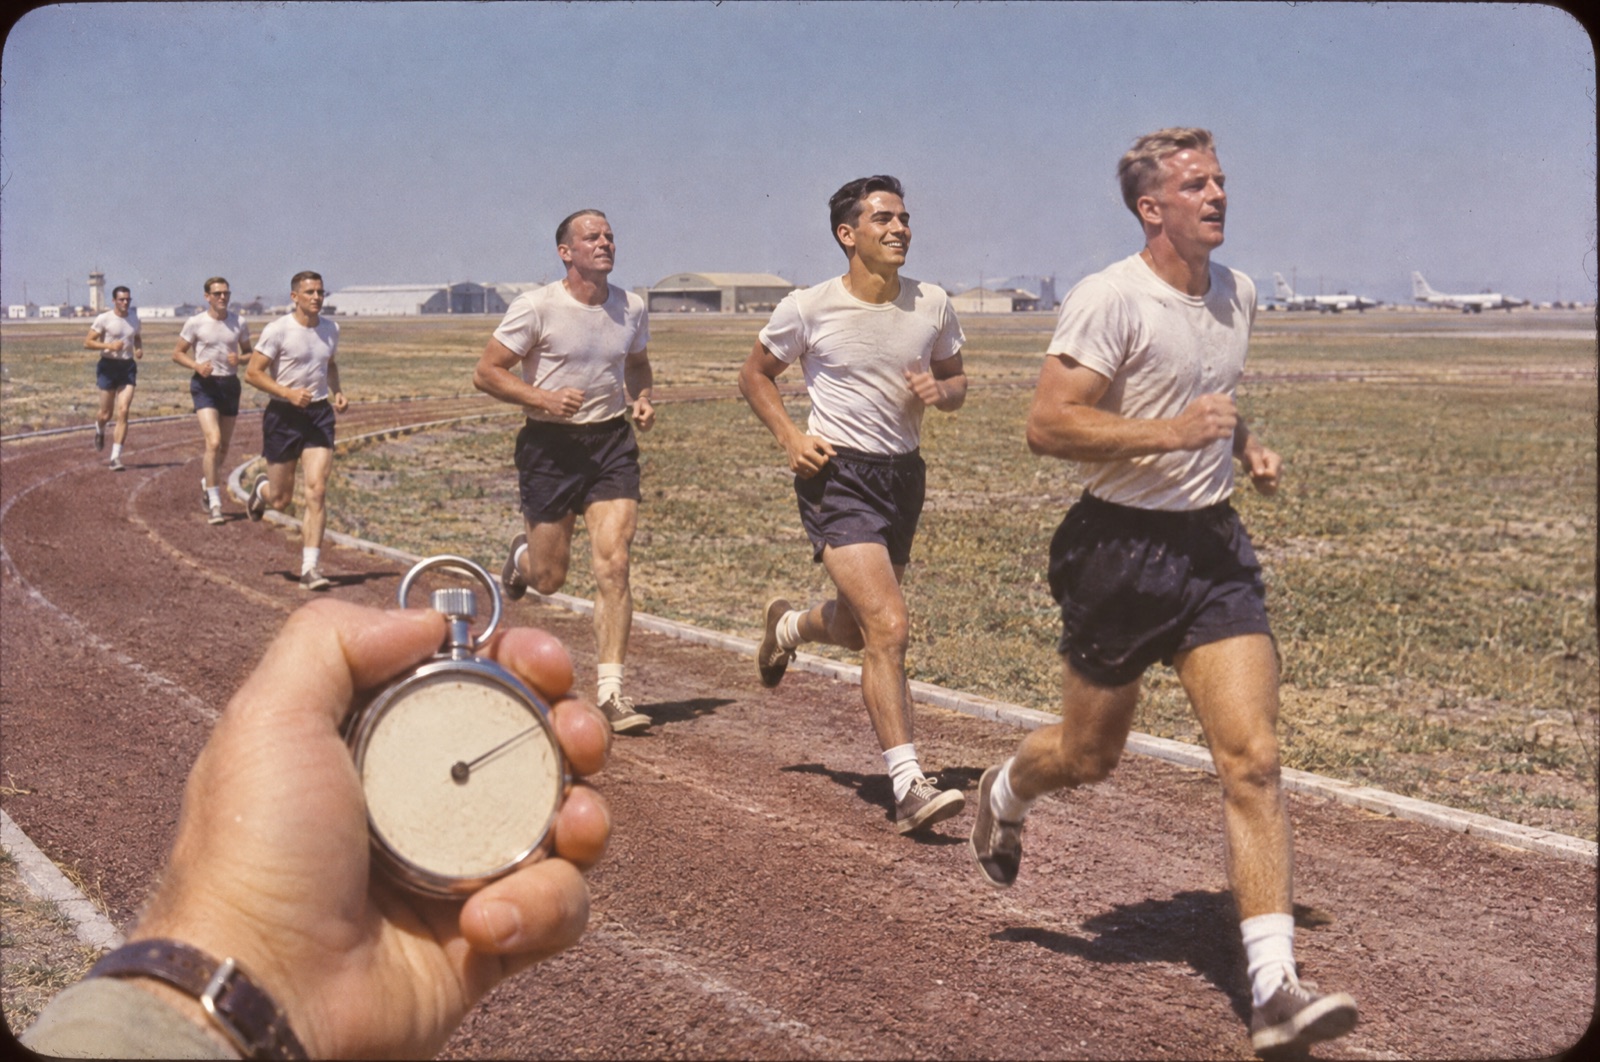
Kenneth Cooper, a physician with the United States Air Force, had a practical problem. A treadmill with gas analysis measures maximal oxygen uptake very well, but it handles one person at a time, and he needed a method for hundreds of people that could be run with a stopwatch in hand.
In January 1968 he published a study in the journal JAMA on 115 men, officers and airmen of the US Air Force. Each ran for 12 minutes for maximum distance and then took a maximal exercise test on a treadmill, within three days according to the Cooper Institute. The correlation between distance and laboratory VO2max was 0.897.
That number is still quoted today without context, and it applies only to men from one service. What remained of it in studies of other groups is described in the section on the limits of the formula.
The test quickly left the military. According to the Cooper Institute, Brazil's national soccer team used it before the 1970 World Cup, and from there it spread to other team sports, schools and uniformed services. For testing large groups, Cooper also derived a fixed-distance version, the 1.5-mile run, which is easier to organize.
How to do the test
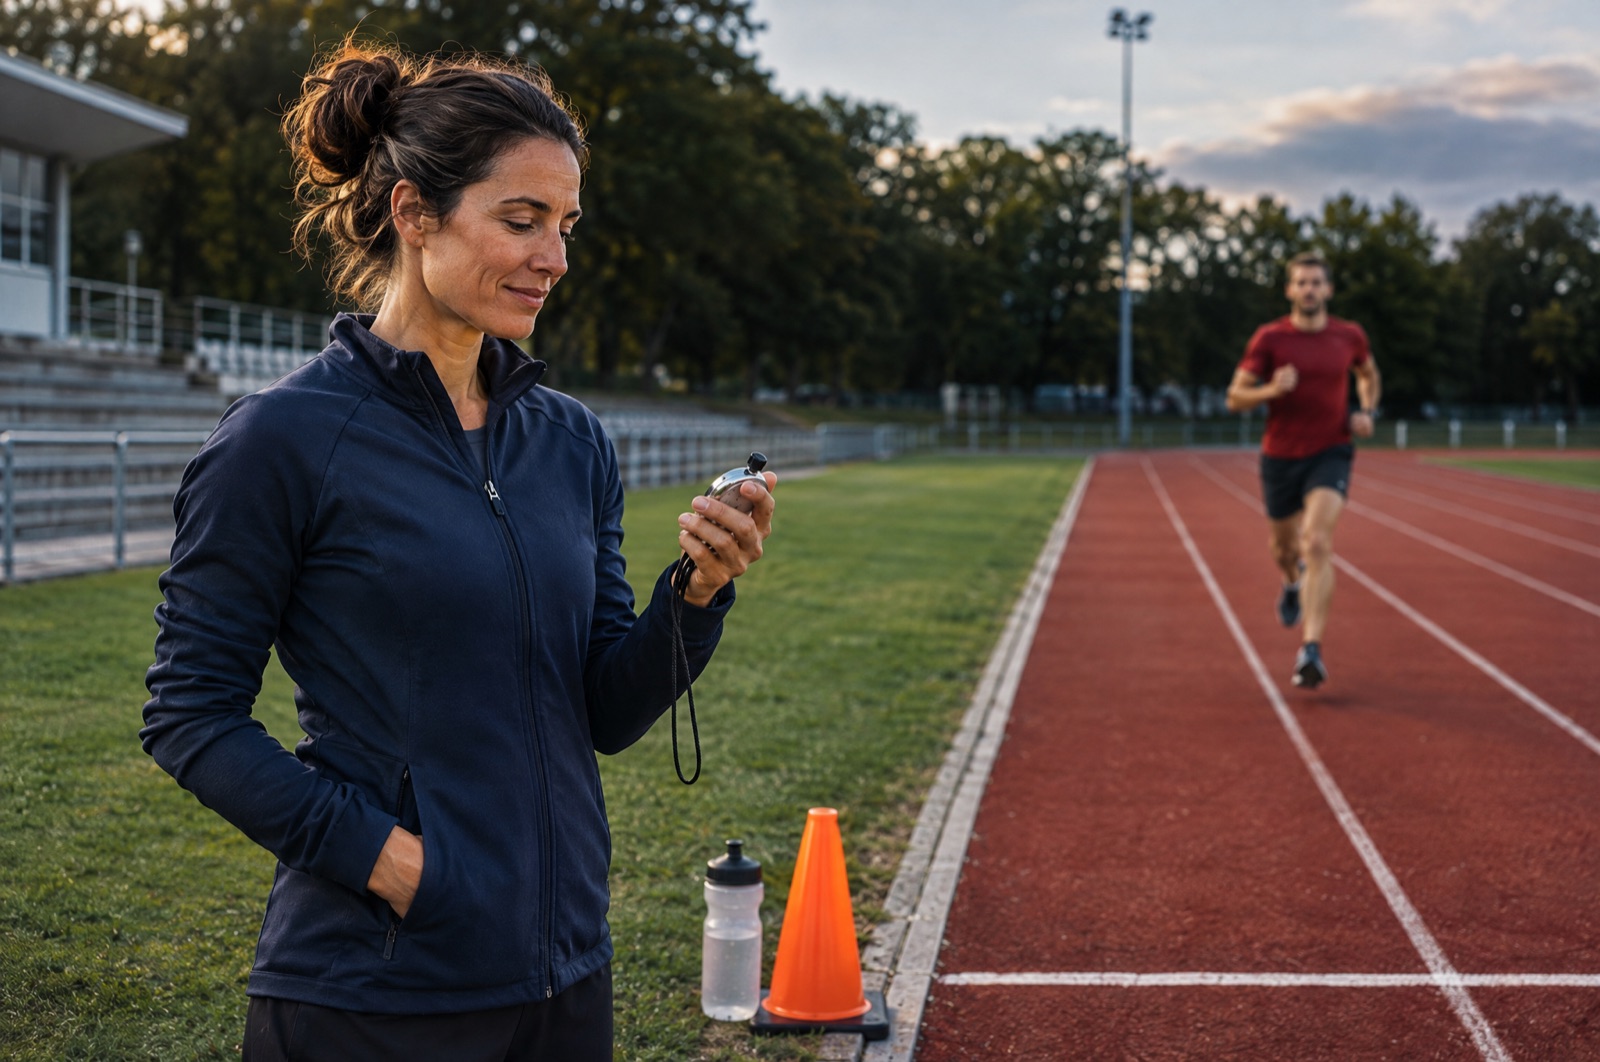
Below is the protocol we use at IMI. The test makes sense only when successive attempts are comparable, so most of the rules are about repeatability.
Where to run
Choose the first option on this list that is available to you:
- A 400 m athletics track. Even, flat, without traffic, and you count the distance from laps, with no need for a GPS watch.
- A measured loop. A path around a pond, sports field or park of known length, without road crossings or sharp corners.
- A flat straight with a turn after 6 minutes. A riverside path, a seafront promenade, a rail trail or a bike path. You run 6 minutes one way, turn and come back.
- A treadmill. Good for icy winters and for hot, humid seasons, but its results form a separate series.
Do not run 12 minutes in one direction. The whole test may then be wind-assisted or into the wind, downhill or uphill. How to count the meters in each of these places is shown in the section on measuring the distance.
- Do successive attempts in the same place and at the same time of day.
- The route must have no places where you have to stop or slow down.
- Run alone. Do not do the test in a group or behind another runner.
- Wear shoes and gear you know. This is not the day to try anything new.
What to prepare
- A 12:00 countdown with an alert. Set a timer or a 12-minute workout step on your watch so that a sound or vibration announces the end. Glancing at the stopwatch in the last minute spoils both the pace and the measurement.
- A marker. A bottle, a cap or a cone that you put down where you stop.
- A helper, if possible. They count laps, call out the time of each and mark the place where the 12 minutes ended. It is the simplest way to avoid a counting mistake.
The day and the hours before the test
- The day before, rest or do a short easy run, with no hard session and no heavy leg exercises.
- Eat an ordinary meal 2–3 hours before the attempt, one you know from training.
- After a sleepless night or with signs of an infection, postpone the test by a few days.
The test step by step
- Warm-up. 15–20 minutes of jogging, including about 5 strides, brisk accelerations of 10–15 seconds. If you want to stretch, keep it dynamic.
- Start. Do not begin too hard. Twelve minutes of hard running is a long time, and whatever you overspend in the first three minutes you repay with interest.
- Middle. Hold the same pace all the way. Uneven pace and running in a group are common causes of error.
- Finish. Speed up only in the final stretch.
- Stop. Stop exactly where you hear the alert and put the marker down. You should feel very tired. Only then does the result mean anything.
- Cool-down. 5–10 minutes of easy jogging, then stretching.
Who should choose a different test
The Cooper Institute describes the test as intended for people who are apparently healthy and regularly active. For people with obesity, low activity or joint pain it recommends a walking test, the Rockport 1-mile walk. The Cooper test is a maximal effort, so with heart disease, chest pain, dizziness or after a long break, talk to a doctor first. Without a running base, start with walk-run sessions.
How to measure the distance
In the Cooper test the result is meters, so a measuring error is an error in the result. Every 45 m is about 1 ml/kg/min in the estimate of aerobic capacity, and a GPS watch can be off by 80–150 m. So wherever you can, take the distance from the route, not from the watch.
| Where you run | Where the distance comes from | What to watch for |
|---|---|---|
| 400 m athletics track | Full laps times 400 m plus the remainder read from the lines | A lost lap, running in a lane other than lane 1, a track that is not 400 m |
| Measured loop | Laps times the length of the loop plus the remainder | A badly measured loop, cutting corners |
| Flat straight with a turn | The stretch to the turn times two, plus or minus the remainder | Trees and buildings that disturb GPS |
| Treadmill | The distance on the treadmill display | Treadmill calibration, a result that cannot be compared with an outdoor test |
A 400 m track: laps, not GPS
A track is where you need a GPS watch least and where it is least reliable. It records a position every second, and on the curves the recorded line sometimes cuts the corner and sometimes drifts into the outer lanes. Six laps then rarely give an even 2,400 m. Simple arithmetic is more dependable: full laps times 400 m plus the remainder.
- Check the length of the track. A full-size track is 400 m in lane 1. School and community tracks can be shorter: 200, 300 or 333 m. In the United States some older tracks are 440 yards, which is 402.3 m a lap and exactly four laps to the mile. If you are not sure, measure a lap on a satellite map.
- Start from the finish line. It is the white line across all lanes at the end of the home straight. Laps and the remainder are easiest to count from there.
- Run in lane 1, close to the inside edge. Each lane further out lengthens the lap by 7–8 m.
- Count laps with a button, not in your head. Switch off auto lap and press the lap button every time you cross the finish line. The watch shows the lap number and its time, so you see at once whether you are holding the pace. One lost lap is a 400 m error.
- Stop at the alert and put down the marker, without running on to the nearest line.
- Read the remainder from the points on the diagram below and pace out the rest.
On a typical 400 m track each curve is about 116 m and each straight about 84 m, so half a lap is exactly 200 m. Counting from the finish line in the direction of running:
- 100 m falls near the end of the first curve, about 16 m before you come onto the back straight. The curved start line of the 1,500 m is usually there.
- 200 m is the end of the back straight, where the second curve begins. In lane 1 the start line of the 200 m is here.
- 300 m falls about 16 m before you come onto the home straight.
Pace out the stretch from the nearest point to your marker. You can check your step length on the home straight: from the start line of the 100 m to the finish line is exactly 100 m. If walking that stretch takes you 125 steps, one step is 0.8 m.
An example: 6 full laps, then past the 200 m point and another 60 steps. The result is 2,400 + 200 + 48 = 2,648 m, which you write down as 2,650 m.
Metric and imperial markings
Track markings are not the same everywhere, and tracks in the United States in particular can be confusing on a first visit.
- Four laps of a 400 m track are 1,600 m, not a mile. A mile is 1,609.34 m, so the mile start is a curved line a little over 9 m before the finish line. Count your laps from the finish line, not from that mark.
- A 440-yard track adds up differently. Six laps are 2,414 m, a mile and a half. If you count them as 2,400 m, you understate the result by 14 m. That is small, but it is the same every time only if you always test on the same track.
- Some tracks carry both sets of lines. Two start lines a couple of meters (about 7 feet) apart in each lane are a sign that the track is marked for both metric and imperial races. Older imperial tracks are often repainted with metric marks, so the paint alone does not tell you the length of a lap.
- Colors and extra lines vary. Relay zones, hurdle marks and staggered starts fill the track with paint. For this test you need only the finish line and the three points from the diagram.
When lane 1 is taken
Choose one lane and stay in it for the whole test. Work out the distance from the length of a lap in that lane:
| Lane | One lap | Six laps |
|---|---|---|
| 1 | 400.0 m | 2,400 m |
| 2 | 407.0 m | 2,442 m |
| 3 | 414.7 m | 2,488 m |
| 4 | 422.4 m | 2,534 m |
| 5 | 430.0 m | 2,580 m |
| 6 | 437.7 m | 2,626 m |
The values apply to a standard track with lanes 1.22 m wide. Anyone who runs six laps in lane 3 and writes down 2,400 m understates the result by 88 m, almost 2 ml/kg/min on paper. Not every track has standard lanes. Where they are narrower, each lane out adds a little less than the table says. If you cannot find out the lane width, wait for lane 1.
A watch with a track mode
Many sports watches have a separate mode for running on a track. On Garmin watches it is called Track Run. The watch then fits the recorded line to the oval of the track and corrects the distance. Three rules:
- Set the lane number in the activity settings and stay in that lane the whole time.
- Give the watch a few laps. On a track it has not recorded before, the watch needs a few laps to calibrate, so run your warm-up in this mode.
- Count the laps anyway. They are the result, and the watch is the check.
Without a track: a flat straight with a turn after 6 minutes
When you have neither a track nor a measured loop, the best option is a flat, straight and open stretch: a riverside embankment, a promenade, a canal towpath or a bike path. You need half your expected result with a margin, about 1.5–1.8 km (roughly a mile) without road crossings.
Run 6 minutes one way, turn and come back the same way. Set alerts on your watch at 6:00 and at 12:00.
- Wind and gradient work for you one way and against you the other. They do not cancel out: a tailwind gives back roughly half of what a headwind takes, and a downhill does not return the whole climb. The error is still much smaller than in a one-way run and similar in every attempt. On a windy day it is better to postpone the test.
- The turn shows your pacing. If the final alert finds you exactly at the start, both halves were equal. If you are still a few dozen meters short of the start, the first half was too fast.
- Turn in a wide arc, without stopping. The turn costs a few seconds, but the same few in every test.
- GPS is most accurate on a straight. It makes most of its errors on corners, under trees and between buildings. An open straight is the easiest condition for a watch.
Work out the distance like this: twice the stretch from the start to the turn, plus or minus the distance from where you stopped to the start. Remember the turning point and the stopping place by a distinctive object, or mark them, then measure both stretches with the distance tool on a satellite map and compare with the watch.
An example: the turn came 1,290 m from the start, and the final alert 40 m before the start line. The result is 2 × 1,290 − 40 = 2,540 m.
On a regular route it pays to measure once, on the map, points every 100 m in the area where you usually turn and finish: a lamp post, a bench, a driveway. In later tests you can read the result without the watch.
A measured loop
A loop in a park or around a sports field works like a track, as long as you know its length and always run the same line, ideally along the inside edge. Measure it once, properly: with a measuring wheel, on a satellite map, or with a bike computer calibrated on a stretch of known length. Certified road race courses are measured in a similar way: by bicycle with a counter on the wheel, not by GPS watch. Then you count as on a track: laps times the length of the loop plus the remainder.
If you have to rely on GPS
- Record every second, not in a battery-saving mode.
- Use the most accurate satellite mode the watch has: all systems, and multi-band on newer models.
- Get a signal before the start. Wait until the watch has found the satellites and stand for another minute under open sky.
- Turn auto pause off. The watch must not stop the recording by itself at the turn.
- Record the 12 minutes as a separate step or lap, so that warm-up distance is not added to the result.
- Check the recorded track after the run. If the line on the map cuts corners or jumps sideways, measure the route on the map.
- Use the same watch and the same route. Even if the measurement has a constant error, your results can then be compared with each other.
In a park, in forest and between buildings, a difference of 50–100 m between two tests can be measuring error alone. The numbers are in the table in the section on the limits of the formula.
Treadmill
If conditions outside do not allow a test, or you do most of your training on a treadmill at home or in a gym, a treadmill test makes sense too. Three rules:
- Set the incline to 1%. At the speeds checked in research, this gradient best matches the cost of running outdoors, where you work against air resistance.
- Read the distance from the treadmill, not from your watch. Check whether the display is set to kilometers or miles before you write the number down.
- Treadmills in different gyms can be calibrated differently. Test and train on the same one if you can.
How precisely to record the result
On an athletics track you can easily get down to 10 m. With a GPS measurement, round to 50 m, because a finer figure claims a precision the measurement does not have. The Karlsruhe Institute of Technology in Germany rounds results to 25 m.
In winter you may end up on an indoor track, usually 200 m. Running is slower on tight curves, so compare only tests from the same indoor track.
Lap splits: how not to ruin the test with pacing
The most common mistake is the first 3 minutes too fast. Choose a realistic distance and watch your lap times on the 400 m track.
| Goal in 12 minutes | In miles | Time per 400 m lap | Distance every 3 minutes |
|---|---|---|---|
| 1,800 m | 1.12 | 2:40 | 450 m |
| 2,000 m | 1.24 | 2:24 | 500 m |
| 2,200 m | 1.37 | 2:11 | 550 m |
| 2,400 m | 1.49 | 2:00 | 600 m |
| 2,600 m | 1.62 | 1:51 | 650 m |
| 2,800 m | 1.74 | 1:43 | 700 m |
| 3,000 m | 1.86 | 1:36 | 750 m |
| 3,200 m | 1.99 | 1:30 | 800 m |
| 3,400 m | 2.11 | 1:25 | 850 m |
Treat the first test as a trial run. By the second you know what pace is realistic. If the first lap comes out 10 seconds faster than planned, slow down at once. Even 5 seconds of difference per lap is about 100 m over the whole test.
Results table by age and sex
The values in the table are distances in meters. This is the five-level scale you will find reproduced most often, in textbooks, on coaching sites and in school fitness programs in many countries. Some versions label the columns from "very good" to "very bad".
| Age | Sex | Excellent | Above average | Average | Below average | Poor |
|---|---|---|---|---|---|---|
| 13–14 | M | over 2,700 | 2,400–2,700 | 2,200–2,399 | 2,100–2,199 | under 2,100 |
| 13–14 | F | over 2,000 | 1,900–2,000 | 1,600–1,899 | 1,500–1,599 | under 1,500 |
| 15–16 | M | over 2,800 | 2,500–2,800 | 2,300–2,499 | 2,200–2,299 | under 2,200 |
| 15–16 | F | over 2,100 | 2,000–2,100 | 1,700–1,999 | 1,600–1,699 | under 1,600 |
| 17–19 | M | over 3,000 | 2,700–3,000 | 2,500–2,699 | 2,300–2,499 | under 2,300 |
| 17–19 | F | over 2,300 | 2,100–2,300 | 1,800–2,099 | 1,700–1,799 | under 1,700 |
| 20–29 | M | over 2,800 | 2,400–2,800 | 2,200–2,399 | 1,600–2,199 | under 1,600 |
| 20–29 | F | over 2,700 | 2,200–2,700 | 1,800–2,199 | 1,500–1,799 | under 1,500 |
| 30–39 | M | over 2,700 | 2,300–2,700 | 1,900–2,299 | 1,500–1,899 | under 1,500 |
| 30–39 | F | over 2,500 | 2,000–2,500 | 1,700–1,999 | 1,400–1,699 | under 1,400 |
| 40–49 | M | over 2,500 | 2,100–2,500 | 1,700–2,099 | 1,400–1,699 | under 1,400 |
| 40–49 | F | over 2,300 | 1,900–2,300 | 1,500–1,899 | 1,200–1,499 | under 1,200 |
| 50+ | M | over 2,400 | 2,000–2,400 | 1,600–1,999 | 1,300–1,599 | under 1,300 |
| 50+ | F | over 2,200 | 1,700–2,200 | 1,400–1,699 | 1,100–1,399 | under 1,100 |
A separate, much stricter scale circulates for competitive athletes:
| Athletes | Excellent | Above average | Average | Below average | Poor |
|---|---|---|---|---|---|
| Men | over 3,700 | 3,400–3,700 | 3,100–3,399 | 2,800–3,099 | under 2,800 |
| Women | over 3,000 | 2,700–3,000 | 2,400–2,699 | 2,100–2,399 | under 2,100 |
Why this table needs to be treated with caution
Almost every page about the Cooper test shows this table, and almost none says where it comes from. We checked:
- It is not a result of the 1968 paper. That study covered men only, so it could not produce norms for women or teenagers.
- There is no published sample. For this table nobody can point to the group studied, its size or the method. Reference works that print it present it as one example of many tables in circulation and name no source.
- The Cooper Institute does not print it. Its own article on the 12-minute run gives no table of distance norms by age. It points readers to an estimate of VO2max and a fitness category for their sex and age group.
- In Germany the scale entered circulation in the early 1970s. The Karlsruhe Institute of Technology describes the test but does not print the table, and refers readers to newer school materials.
- Versions differ in the details. Different age bands circulate, for example 17–19 and 17–20, as do ranges that overlap, because the table has been copied for decades.
The numbers themselves show it. A man in the 17–19 group needs more than 3,000 m for the top rating, and one ten years older only more than 2,800 m. For women it is the other way round: the threshold rises from more than 2,300 m in the 17–19 group to more than 2,700 m at 20–29. Physiology does not explain that. It probably shows that the table was assembled from different sources.
Use the table as a general scale, not a medical norm. For your training, a comparison with your own result from two months ago means far more.
VO2max from the formula
VO2max, maximal oxygen uptake, is the largest amount of oxygen the body can use in a minute, counted per kilogram of body mass. Together with the lactate threshold and running economy it is one of the three main determinants of endurance performance.
The formula was derived from Cooper's paper:
VO2max = (distance in meters − 504.9) / 44.73
The version in miles gives practically the same answer: 35.97 × miles − 11.29. An example: 2,400 m is (2,400 − 504.9) / 44.73 = 42.4 ml/kg/min.
A simple rule follows from this. Every extra 45 m in the test is about 1 ml/kg/min on paper. That is why measuring the distance accurately matters so much.
The limits of the formula
A correlation of 0.897 means that distance explained about 80% of the differences in VO2max in that group. Later studies are less optimistic.
| Study | Who was tested | What came out |
|---|---|---|
| Cooper, 1968 | 115 men from the US Air Force | r = 0.897 |
| Mayorga-Vega et al., 2016 | Meta-analysis of 123 studies, children and adults | For the 12-minute test r = 0.78 (0.72–0.83). Together with the 1.5-mile run it is the best of the field tests. Sex, age and VO2max level did not change this validity. |
| Penry et al., 2011 | 60 young healthy people, 21 with a treadmill test | Very good repeatability (0.96), but the formula underestimated VO2max in the less fit and overestimated it in the fitter. |
| Bandyopadhyay, 2015 | 88 untrained male students from Kolkata | In the main group (58 men) the Cooper formula gave 42.8 against a measured 39.8 ml/kg/min. The author derived a separate formula for this group. |
The last two studies point in opposite directions. One found underestimation in the less fit, the other overestimation in untrained people. They are small and concern different populations, so no single correction can be drawn from them. For one individual the formula can be off by several ml/kg/min in either direction. A correlation of about 0.78 means that about 40% of the differences in VO2max remain unexplained.
The reason is physiological. The test result also depends on running economy, body mass, experience in pacing and tolerance of discomfort. Two people with the same VO2max can cover distances several hundred meters apart. VO2max from the formula is an estimate, not a direct measurement.
What measuring errors cost
| Cause of error | Scale | Effect on VO2max from the formula |
|---|---|---|
| Rounding to 50 m | 50 m | about 1.1 ml/kg/min |
| GPS watch, 3.2% error at 2,500 m | about 80 m | about 1.8 ml/kg/min |
| GPS watch, 6.1% error at 2,500 m | about 150 m | about 3.4 ml/kg/min |
| A 440-yard track counted as 400 m | 14 m over six laps | about 0.3 ml/kg/min |
| A treadmill in a different gym | unknown, depends on calibration | makes attempts impossible to compare |
The GPS percentages come from a test of eight sports watches. The mean absolute error ranged from 3.2% to 6.1%. In cities and in forest the watches usually understated the distance, by as much as 9%. On an athletics track they overstated it, but 6 of 8 kept good accuracy there. It is one more argument for the track and for counting laps. Differences of 50–100 m between two GPS tests in a park can be noise alone.
Weather and time of day
There are no good data on how weather affects the 12-minute test specifically. In marathons the most important weather factor is temperature, with an optimum between 3.8 and 9.9°C (39–50°F) depending on the level of the runner. In a short test the scale will be different, but the direction is the same. A test at midday in high summer and one on a cool morning are not comparable, which is why the protocol tells you to keep to the same time of day. Humidity adds to heat, wind costs more than it returns, and ice or snow shortens your stride, so choose a clear loop, a treadmill, or another day.
From the result to training pace
The greatest practical value of the test lies in your average speed over the 12 minutes. It is your personal reference point, and the training zones are percentages of that speed. The calculator at the top of the page converts them into paces, and each time-goal page shows them for the test result that matches that goal.
| Zone | Share of test speed | Example for 2,400 m, per km | Per mile |
|---|---|---|---|
| Easy | 62–72% | 6:57–8:04 | 11:11–12:59 |
| Aerobic | 72–80% | 6:15–6:57 | 10:04–11:11 |
| Tempo | 80–88% | 5:41–6:15 | 9:09–10:04 |
| Threshold | 88–94% | 5:19–5:41 | 8:34–9:09 |
| VO2max | 96–102% | 4:54–5:13 | 7:53–8:23 |
These zones are a starting point. The same percentages produce a different effort in someone with a lot of training volume and in someone returning from a break. The exact zones are set by a coach after the test, and in training you can also check them with the talk test.
The same math tells you what share of your test speed you can hold in a race. With the Riegel formula it looks like this:
| Duration of effort | Typical distance for a recreational runner | Share of test speed |
|---|---|---|
| 25 minutes | 5K | 96% |
| 50 minutes | 10K | 92% |
| 2 hours | Half marathon | 88% |
| 4 hours | Marathon | 84% |
For the marathon this is more of an upper limit. The Riegel formula describes world records, and in recreational runners the drop is larger. The corrected exponents are on the pace calculator page.
The most common mistakes in the test
- First laps too fast. The loss at the end is usually larger than the gain at the start.
- A test after a heavy week. You are then measuring fatigue, not fitness.
- Running in a group or behind someone. The result is better, but cannot be repeated in the next test.
- Different measuring places. Two GPS tests on two routes are not comparable.
- No warm-up. The first minutes are then the warm-up, not the test.
- Easing off at the end. Without real fatigue the result understates your fitness, and your zones will be too slow.
- Counting laps in your head. One lost lap is a 400 m error. Count them with the button on your watch or ask someone to help.
- Mixing units. A treadmill set to miles, a watch set to kilometers and a track counted in laps give three different-looking numbers. Write the result down in meters every time.
When to test during the year, and how often
The test makes sense at the start of a training block and about every 8 weeks after that. With more frequent tests you mostly measure fatigue and weather, and with less frequent ones it is easy to miss the moment when the zones should move. What changes around the world is the weather those dates fall into, because a test in freezing wind and one on a mild still evening are not comparable.
| Conditions where you live | Where to test | What to watch for |
|---|---|---|
| Cool and dry: spring or autumn in a temperate climate, the cool season elsewhere | Athletics track | Usually the best conditions of the year for a test record. Do not test right before a race |
| Late autumn, the start of a block for a spring race | Athletics track, if it is dry | A wet surface and wind. After a night frost the track can be slippery in the morning |
| Snow, ice or deep cold | A treadmill at 1% incline or an indoor track | Do not compare with an outdoor test. Treat it as a new series |
| Hot summer | Athletics track, early morning or evening | Heat lowers the result, so do not move your zones down after one test |
| Hot and humid all year, as in the tropics | Athletics track at dawn, always at the same hour, or an air-conditioned treadmill as a separate series | Your results will sit below what the same fitness gives in cool air. Compare them only with each other |
| Rainy or monsoon season | A treadmill, or the track on a dry day | Standing water and a slick surface change your stride and the result |
| High altitude | The track where you train | Results are lower than at sea level. Set zones from a test done at the altitude you train at |
In the southern hemisphere the same rows apply six months apart: the snow-and-ice row belongs to June to August, and the hot-summer row to December to February.
An example for a northern spring marathon, Boston on April 19, 2027. A 20-week block starts at the end of November, so the first test falls then, on a dry track. The second comes about 8 weeks later, in late January, on a treadmill if winter demands it, as the start of a new series of measurements. The last check of pace is done in training. For a marathon at the end of August in the southern hemisphere, such as Sydney, the same pattern gives a first test in April and a second in June, both in the cool part of the year. A test 2–3 weeks before the race usually tires you more than it helps.
Judge progress with care. Since the precision of the measurement is 50 m, and GPS can be further off, a difference of less than 100 m proves nothing yet. The trend from three tests says more than one record. If you train to a plan, do the test when it appears in your calendar.
Cooper test or a 5K test
| Cooper test | 5K test | |
|---|---|---|
| What you measure | Distance in a fixed time | Time over a fixed distance |
| Duration for a recreational runner | 12 minutes | about 20–35 minutes |
| Biggest risk | An error in measuring the distance | Going out too hard |
| Similarity to racing | Lower | Higher, it is a real race distance |
| When it is better | You have a track and little experience of pacing a longer effort | You have a certified race or a well-measured loop |
At IMI we normally schedule the Cooper test. In exceptional cases the coach may accept a chip time from a 5K race on a certified course. You do the test when it appears in your calendar. Do not mix the results of the two methods in one comparison of progress. The Cooper Institute describes a third route as well: the 1.5-mile run, which is 6 laps of the track and 14 m, where VO2max is calculated as 483 divided by the time in minutes, plus 3.5.
What to do with the result
| Result compared with the previous one | What it probably means | Decision |
|---|---|---|
| Better by more than 100 m | Real progress, if conditions were similar | Move the zones |
| Within about 100 m | Measuring noise or a small change | Leave the zones, watch the trend |
| Worse by more than 100 m | Fatigue, illness, conditions or a drop in fitness | Check the context, do not increase the load. If in doubt, repeat after recovery |
The result also helps you choose a goal. In the table of goals every time has its Cooper test equivalent. If you are more than 300 m short of a goal, it is more likely a goal for a later season than for the next block. If you have not been running long, progress can be faster, so the threshold is looser. That is our reference point, not a research result.
Three typical scenarios
| Situation | What it shows | What to do |
|---|---|---|
| 1,900 m, with walking toward the end | The result says more about endurance than about speed. The Easy pace from the calculator may be too fast | First 30 minutes of continuous running, then another test |
| 2,500 m, first test | About 25:00 for 5K and 52:10 for 10K | Choose a goal one step further and set the zones |
| 3,100 m on 20 km (12 miles) a week | Good speed, little volume. The Riegel formula will promise too much in the half marathon and the marathon | Add distance before you believe the prediction |
Frequently asked questions
What is a good Cooper test result?
At 30–39, the above-average rating starts at 2,300 m (1.43 miles) for men and 2,000 m (1.24 miles) for women. This is a general scale of uncertain origin, so treat it as a rough guide. Your own progress is a more reliable measure.
Can I do the Cooper test without a running track?
Yes. On a measured loop, on a flat straight with a turn after 6 minutes, or on a treadmill at 1% incline. Avoid running one way only and stretches with traffic lights.
How do I count the distance in the Cooper test on a track?
Multiply the number of full laps in lane 1 by 400 m and add the remainder. Count the laps with the lap button on your watch and read the remainder from the 100, 200 and 300 m points. On a 440-yard track a lap is 402.3 m. The full description is in the section on measuring the distance.
Is a GPS watch accurate enough for the Cooper test?
On an open straight, usually yes. In a park, in forest and in a city the error can reach 80–150 m, and on a track it is better to count laps or switch on the track mode.
Can I walk during the Cooper test if I run out of energy?
Yes, the distance counts, but the result will understate what you can do. If you cannot yet run 12 minutes without walking, the test is not the best measure. Build continuous running first.
How accurate is VO2max from a watch compared with the Cooper test?
Both are estimates. The gold standard remains a laboratory exercise test with gas analysis. Do not compare numbers from two methods, because they can differ even when your fitness has not changed.
Can the Cooper test predict my marathon time?
Only very roughly. For 5K and 10K the prediction is often reasonable, but a marathon result also depends on volume, fueling and pacing, which 12 minutes do not measure. In a study of 2,303 recreational runners the Riegel formula with exponent 1.07 gave half of them a time at least 10 minutes too fast, and the prediction there was made from another race, not from the test.
How far should I run in 12 minutes?
As far as you can at an even, hard pace. For orientation: 2,400 m is six laps of a 400 m track and an average of 5:00/km (8:03/mile), which the formula converts to about 42 ml/kg/min. Use the lap splits table to pick a realistic target before you start.
How do I convert the result into training paces?
Enter the distance in the calculator at the top of the page. It shows the zones per kilometer or per mile. At 2,400 m the Easy zone is 6:57–8:04/km (11:11–12:59/mile) and Threshold is 5:19–5:41/km (8:34–9:09/mile).
How can I improve my Cooper test result?
Regularity first: a few weeks of easy running 3–4 times a week. Add one harder session a week in the Threshold or VO2max zone. In the next attempt even pacing helps too, so hold the lap times from the splits table. If you want the sessions set for you, a running coach builds them from the test.
Is the Cooper test safe?
For healthy, regularly active people usually yes, but it is a maximal effort. With heart symptoms, chronic illness, pain or after a long break, talk to a doctor first.